ghhghhgg
There is nothing so strong or safe in an emergency of life as the simple truth. -Charles Dickens
The scope and variety of information provided on the internet are amazing. There are hundreds, if not thousands, of articles on almost any subject.
The problem is that in many cases it’s hard to discern whether the information provided is a fact, opinion, or statistically correct information bent to fit the situation.
A casual reader scanning an article may not realize that the article may be statistically correct but slanted in one direction or another. (The article could also be opinions disguised as facts or facts that are slanted opinions.)
A good example would be an article found while researching information for this blog. The April 23, 2015 article is by Gallup News and states:
“Americans Again Say Real Estate Is Best Long-Term Investment”. For the second straight year, more Americans name real estate than stocks, gold, savings accounts/CDs, or bonds as the best long-term investment. Real estate leads with 31% of Americans choosing it, followed by stocks/mutual funds, at 25%. Meanwhile, gold dropped to third this year, a significant change from 2011 and 2012, when it was the runaway leader.

The article would lead a casual reader to believe that Real Estate is the best place for long-term investment dollars. But, closer examination reveals that the article only states what Americans think is the best long-term investment, and further examination reveals that results for this Gallup poll were based on telephone interviews conducted April 9-12, 2015, with a random sample of 1,015 adults, aged 18 and older, living in all 50 U.S. states and the District of Columbia.
While the article is factually correct, the information is useless from a historical and factual basis in that it only states what 1015 people think, not historical facts about Real Estate investment returns.
Would you want to base your investment strategy on the thoughts of 1015 random people instead of factual information?
The chart below released in August 2022 by Northern Trust shows the actual five-year returns from 2017 to 2022:
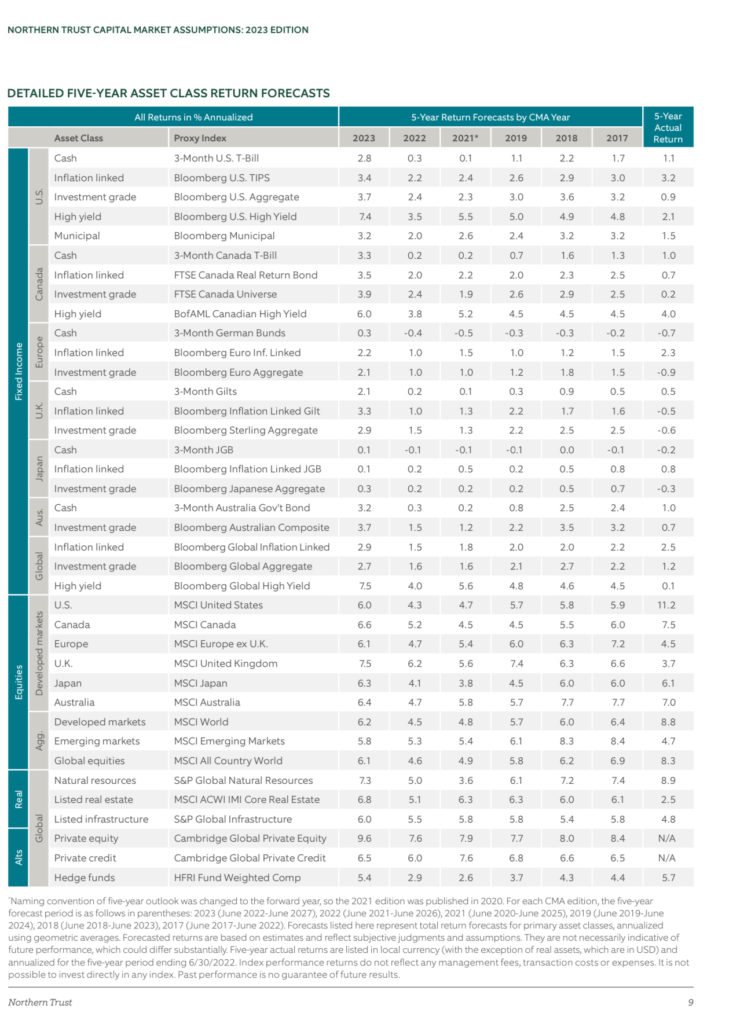
The actual five-year returns (listed to the far right on the chart above)
shows that listed real estate from 2017-2022 returned 2.5% while US equities returned 11.2%.
Investing in Real Estate in 2015 based on the 2015 Gallup article would have resulted in an 8.7% lower return on investment for the 2017-2022 period.
This is the intersection of opinion and reality!
Investing in Real Estate was the opinion in 2015. An 8.7% lower return versus stocks from 2017-2022 is the reality.
ggfgfgfgfgugff
What investment provides the best long-term results?
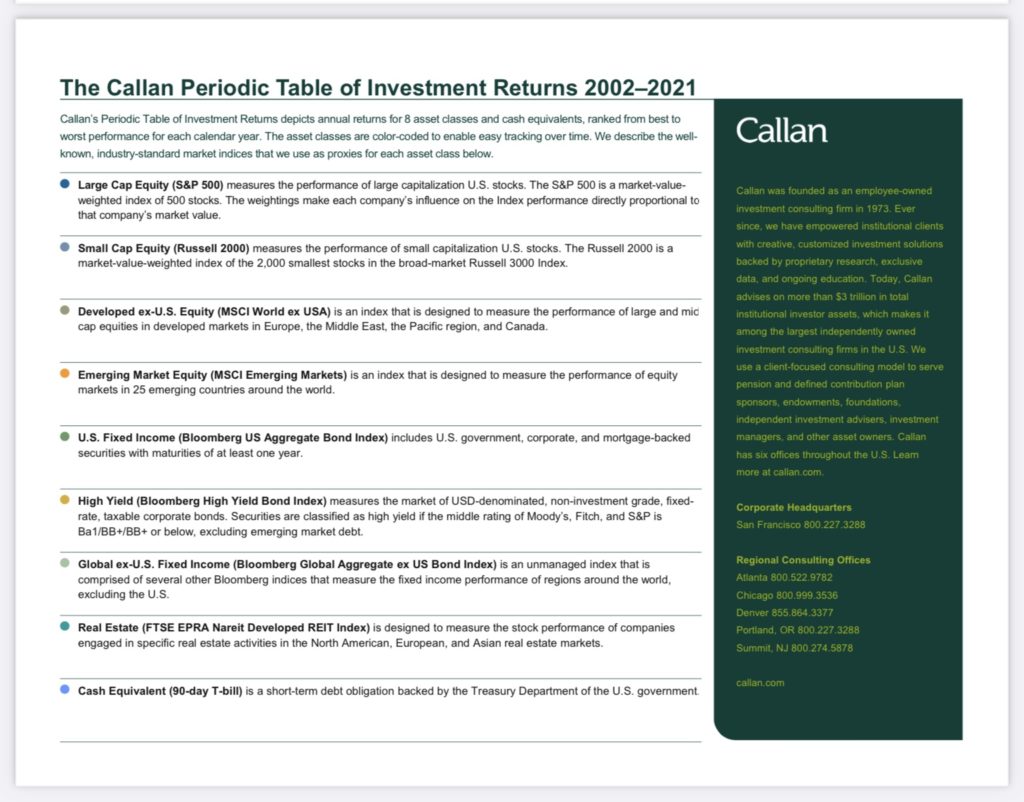
To begin, it’s important to understand that investments have differing performance over time. The Callan periodic table is a perfect example of this fact. As stated by Callan.com, the Callan Periodic Table of Investment Returns graphically depicts annual returns for various asset classes, ranked from best to worst. Created by Jay Kloepfer in 1999, the table features well-known, industry-standard market indices as proxies for each asset class. The following graphs from the Callan Institute illustrate this continual performance movement among asset classes.
The Callan periodic table lists nine major asset classes. The listed asset classes are: Large Cap Equity, Small Cap Equity, Developed ex-US Equity, Emerging Markets Equity, US Fixed Income, High Yield Bonds, Global ex-US Fixed Income, Real Estate, and Cash Equivalents. (Not listed in the Callan table are Gold and Alternative Investments which are comprised of non-traditional asset classes, such as Real Estate, Crowdfunding, Peer-to-peer lending, Commodities, Hedge fund investing, Cryptocurrency, and Art.)
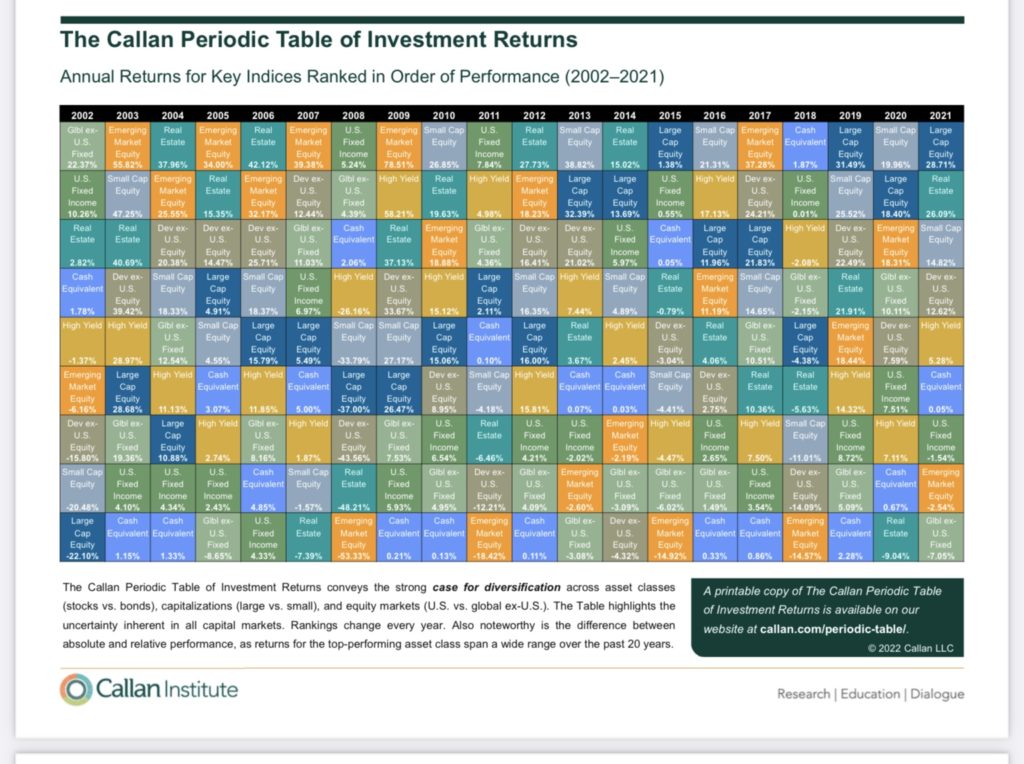
The Callan periodic table shows the relative returns of different investments over ten years. It shows very clearly that what may be the best-performing asset one year can be the worst-performing asset the following year (In 2007 Emerging Market Equity was the best-performing asset with a 39.38% positive return for the year. In 2008 it was the worst-performing asset with a negative 53.33% return.) So, in the space of one year Emerging Market Equity went from the best to the worst-performing asset.
It is impossible to predict the future, and obviously, past performance is not indicative of future performance. But, historical information gives a good indication of what has performed best over long periods. Let’s zoom out to approximately 35 years and look at historical data from Visual Capitalist from 1985 to 2020 for different asset classes:

The same pattern appears in a 35-year sampling. Best-performing asset classes move up and down the return spectrum from year to year based on return.
So, Now it’s established that asset performance varies over time, and there are many asset classes available for investment.
fhfhfhfhfhfhf
The two big questions are:
What is the best way to mediate risk?
What asset class has provided the best historical returns?
hghghghghghg
What’s the best way to mediate risk?
ghghghhg
There is a Stock Market adage that states that gains come from time in the market, not timing the market. When investing, time is your friend. In the stock market, both stock earnings and stock prices have risen over long periods.


The next chart shows the probability of S&P 500 Index gains over various rolling periods since 1950. Stock Market gains were higher in more than 80% of all rolling 3-year and 5-year periods and 92% of all 10-year rolling periods. The S&P 500 was higher 100% of the time for all rolling 15-year periods.
Investors who continuously remained in the Market longer than 15 years achieved positive returns 100% of the time!

Notice how the last paragraph stated that investors who continuously remained in the market over 15 years achieved positive returns 100% of the time.
The next chart shows the effects of missing out on between one and twenty of the best Market days. Although the S&P 500 Index is unmanaged, owning stocks for the long run has been very rewarding (and moving in and out and potentially missing out on gains can be costly.) Missing the twenty best Market days between 1990 and 2021 turned an annualized 9.9% gain into an annualized 24.4% loss!

According to Jeffery Buchbinder, CFA, Equity Strategist: Stocks experienced some significant downdrafts during the 31-year period shown in the chart (2000-2002 and 2008-2009 to be specific) and yet the S&P 500 Index still rose an average of 9.9% per year during that time.
The charts and written statements above make it abundantly clear that risk mediation and best performance occur with investors who are continuously invested over long periods and don’t attempt to time market movement.
jgjhgjhgjhghghgh
What asset class has provided the best historical returns?
ghghhghhihhg
Long-term investments are normally termed as investments with a time horizon longer than one year. As noted above, the best and most predictable returns occur after an investing horizon of at least ten years.
fhfhfhhfhghg
Investors should also consider:
- Risk tolerance level- investing involves risk. There is the risk of losing money on any given asset in your portfolio, or the entire portfolio. Every investor should evaluate the ability to tolerate risk and market losses (even for years.)
- Investment time horizon- young investors can afford to be more aggressive with investments because they have a much longer time horizon ( anywhere from 10- 50+ years) and time to make up for any short-term losses. Investors nearing retirement will need to be more conservative in investment choices because they can’t afford short-term losses due to a shorter investing horizon and the inability to catch up in the long term.
- Specific investments- be sure the fund is consistent with your overall investment objectives. Both individual companies, mutual funds, and all other asset classes require a deep analysis including financial position, product lines, current, and future growth potential, credit rating, and market position.
jhjghjghghghgu
But which asset class has the best historical return:
Stocks have a better track record among assets over the rate of inflation in the long run.
Here are the annual real returns by decade:

In almost every 10 years from 1800- 2019 stocks have outperformed other asset classes. According to Investopedia:
- The U.S. stock market is considered to offer the highest investment returns over time.
- Higher returns, however, come with higher risk.
- Stock prices typically are more volatile than bond prices.
- Stock prices over shorter periods are more volatile than stock prices over longer periods.
- During shorter periods, the market doesn’t get the chance to recover from the economic events and conditions that can affect prices and returns.
hghghhghhgg
Long-Term Returns From Stocks
The stock market has proven that it produces higher gains over long periods compared to bonds. For example, one hundred dollars invested in the Standard & Poor’s 500 Index (S&P 500) in 1928 would have been worth more than $700,000 by 2021. In comparison, the same $100 invested in 10-year Treasuries for the same period would have been worth only a little more than $8,500.

The chart above shows the real return for Stocks from January 1802- December 2016 as an annualized return of 6.7%. (Real return is what is earned on an investment after accounting for taxes and inflation. Real returns are lower than nominal returns, which do not subtract taxes and inflation.)
hghhhghghg
How about stocks versus housing?
Between 1890 and 2015, after accounting for inflation, U.S. home prices rose less than 1% annually.
Commodities are not much better having returned 3.97% annualized over the last thirty years.
The following chart by lazyportfolioetf.com provides good summary information:
Asset Class Historical Returns
Asset Class Returns, for last 1,3,6 Months and 1,3,5,10,30 years.
Columns are sortable, Asset Classes are pre-ordered by 30-year return.
ASSET CLASSES – HISTORICAL RETURNS (%). Last Update: 31 October 2022
(Cells with red backgrounds indicate returns lower than the US Inflation recorded in the same period. US Inflation is updated to Sep 2022. Waiting for updates, inflation of Oct 2022 is set to 0%. Current inflation (annualized) is 1Y: 7.31% , 3Y: 4.87% , 5Y: 3.77% , 10Y: 2.52% , 30Y: 2.49%)
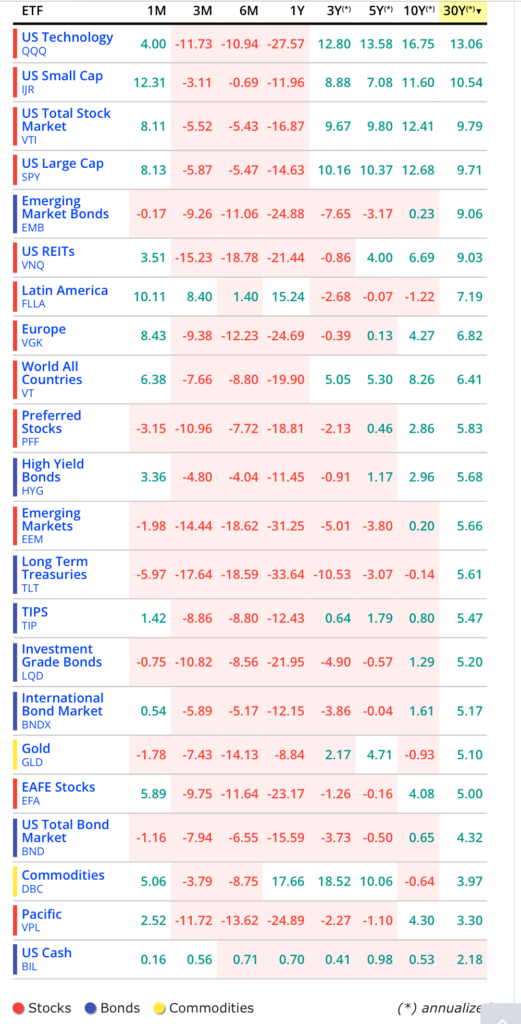
Stocks Bonds Commodities. (*) annualized
On an annualized basis for the last 30 years:
- The US Total Stock Market returned 9.79%.
- The US Total Bond Market returned an annualized return of 4.32%.
- Commodities returned 3.97%
- US Cash returned 2.18%
- Gold returned 5.10%
- TIPS returned 5.7%
When considering the major investment asset classes, Stocks have handily beaten the other major groups.
hdhjdhdhdhdjdjdhd
Final Thoughts
- It’s hard to discern whether the information provided on the Internet is a fact, opinion, or statistically correct information bent to fit the situation.
- Investment returns vary in the short term but provide positive long-term results as earnings and stock prices rise over time.
- Success favors the long-term investor.
- The Callan Periodic Table of Investment Returns shows that different asset classes rotate from best to worst performers over time.
- Risk Mediation and best performance occur with investors who are continuously invested over long periods and don’t attempt to time market movement.
- Investors need to consider risk tolerance level, investment time horizon, and evaluation of specific investments.
- In almost every 10 years from 1800- 2019 stocks have outperformed other asset classes.
- Stocks have traditionally returned in the neighborhood of 10% annualized returns (1990-2021 annualized returns were 9.9%.)
- It is possible, but not recommended, to incorporate a 100% stock portfolio. This would be a good way to live with a knot in your stomach for a great deal of the time! (A future Blog will discuss Portfolio design and composition.)
- Stocks, Stock Mutual Funds, or Stock ETFs should be an integral part of any long-term investing strategy.
fhfhfhdsjhdhdhdhhd
If you’d like to be a part of a free online retirement community, join us on Facebook:
COMMENTS